You win 6 out of 10 bets. You figure you're profitable. Then you do the math and realize you've lost money. How is that even possible?
Quick answer
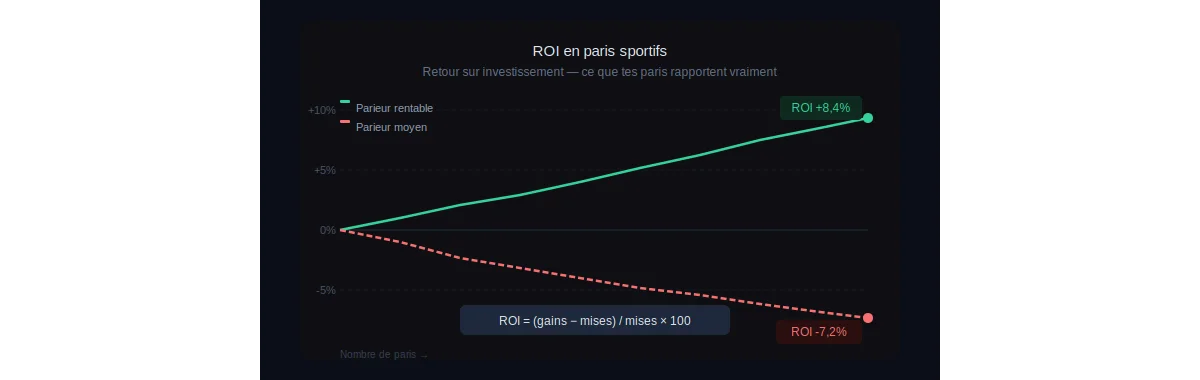
Betting ROI = (net profit ÷ total amount staked) × 100. A sustained ROI of 3-7% over 200+ bets puts you among the best; most bettors are negative. Below 200 bets, ROI mostly measures luck, not skill — sample size is what turns a hot streak into evidence.
Because win rate only tells you part of the story. A bettor can hit 70% of their picks and still bleed money. Another can go 40% and be comfortably in the green. The difference is ROI. And most bettors can't calculate it, let alone interpret it.
Here's what ROI actually measures, how to calculate it correctly, and why it's the only metric worth trusting when you're trying to figure out if you're a winning bettor or just a lucky one.
Why Win Rate Lies to You
Win rate is simple: it's the percentage of bets you win. If you place 100 bets and win 55 of them, your win rate is 55%. Sounds solid. But it tells you absolutely nothing about whether you made or lost money.
Consider two bettors:
Bettor A has a 65% win rate. He bets primarily on heavy favorites at short odds (-500 to -250 range, or decimal 1.20–1.40). Over 100 bets at $10 each, he wins 65. His average return on a winning bet at these odds is roughly $3. Total winnings: $195. Total losses: $350. Net result: -$155. He wins most of the time. He loses money.
Bettor B has a 38% win rate. She bets on underdogs and mid-range lines (+150 to +250, or decimal 2.50–3.50). Over 100 bets at $10 each, she wins 38. Average return on a winning bet: $20. Total winnings: $760. Total losses: $620. Net result: +$140. She loses more often than she wins. She makes money.
Win rate ignores odds and stake amounts entirely. ROI incorporates everything: what you bet, what you win, what you lose. It's the only number that tells you the truth.
How to Calculate Your ROI
The formula is straightforward:
ROI = (Net Profit ÷ Total Amount Wagered) × 100
Concrete example. You placed 50 bets this month. Total wagered: $500. Total returned (winning payouts + returned stakes): $540.
ROI = (540 − 500) ÷ 500 × 100 = +8%
That means for every dollar you put at risk, you made 8 cents. Over the long run, that's a very strong number.
Another example. You wagered $1,000 over the month. Total returned: $920.
ROI = (920 − 1,000) ÷ 1,000 × 100 = -8%
You're losing 8 cents per dollar wagered. Not a disaster, but you're not profitable.
What Counts as a Good ROI and When to Worry
There's no universal "normal" ROI, but here are honest benchmarks based on what long-term winning bettors actually look like.
+1% to +5%: You're profitable
This is where most winning bettors actually land over large sample sizes. It doesn't sound like much, but across hundreds of bets and meaningful stakes, it compounds into real money.
+5% to +10%: You're very good
Very few bettors sustain this level over 500+ bets. If you're here with a large sample, you've built a genuine edge.
Above +10%: Exceptional or small sample
Either you're exceptional, or your sample is too small to draw conclusions. A +15% ROI over 30 bets is statistically meaningless. The same number over 1,000 bets is remarkable.
0% to -5%: Near break-even
You're close to break-even. Small adjustments to your process — better line shopping, tighter bet selection, improved bankroll management — can flip this to positive.
Below -10%: Structural problem
There's a structural problem. Your odds are consistently too short for your win rate, your staking is off, or you're betting without a repeatable process.
Sample Size: Why Your ROI Means Nothing Under 200 Bets
An ROI calculated on 10 or 20 bets is statistical noise. Variance in sports betting is brutal. You can run 8-2 one week and 2-8 the next without your underlying process changing at all.
The baseline rule: your ROI becomes meaningful starting around 200 to 300 bets. Below that, you're measuring luck as much as skill. This is why tracking every single bet, every day, over months — and not just a good week — is non-negotiable.
It's also why you should always ask a tipster how many total picks back up their ROI claim. A +20% ROI over 50 picks is a marketing number, not a performance indicator. Get the sample size first.
The Metrics You Should Be Tracking Alongside ROI
ROI is the headline number, but it won't tell you where you're winning or why you're losing. These supporting metrics are what actually help you improve.
Average odds
If your average line is -400 (1.25 decimal), you need to win 80% of bets just to break even. If your average is +150 (2.50 decimal), you only need 40%. Knowing your average odds tells you what win rate you need to target to be profitable before you even place a bet.
Yield per bet
A variation on ROI that gives you average profit per bet. If your ROI is +5% and your average stake is $20, your yield is +$1 per bet. Over 500 bets, that's $500 in profit. Useful for projecting what a sustainable edge actually looks like at scale.
ROI by category
Your overall ROI can be positive while you're quietly bleeding money in a specific area. Breaking it down by sport, bet type (straight bets vs. parlays), sportsbook, and odds range is where you find the real picture. You might be running +12% on NFL and -15% on college basketball. Without that breakdown, you'd never know, and you'd keep making the same losing bets.
Streaks
Your longest winning and losing runs. Not a profitability metric, but a variance metric. If you know your worst losing streak historically was 11 bets, you don't panic and start chasing when you drop 8 in a row. Emotional discipline depends on knowing your own variance.
How to Actually Track Your ROI
To calculate ROI, you need to log four things for every bet: date, stake, odds, and result. No exceptions. Without that data, you're flying blind.
Most bettors start with a spreadsheet. It works for about two or three weeks, until logging every bet becomes a hassle and the spreadsheet gets abandoned. The friction is real.
That's the exact problem mybankroll.io is built to solve. You log a bet in a few seconds, and your ROI — overall, by sport, by book, by bet type — updates automatically. No formulas to maintain, no discipline required to keep a spreadsheet alive.
Because here's the thing: ROI only has value if you track it consistently over time. A number you calculate once and forget helps no one. It's the week-over-week, month-over-month trend that shows you whether your process is actually working — and where to adjust when it isn't.
Frequently Asked Questions
How do you calculate ROI in sports betting?
ROI = (Net Profit ÷ Total Wagered) × 100. Example: you wagered $1,000 and profited $80, so ROI = 80 ÷ 1,000 × 100 = 8%. It measures actual profitability, not how often you win. mybankroll.io calculates this automatically on every bet.
What's a good ROI in sports betting?
A positive ROI over 200+ bets is already above average. +3% to +5% is solid, +5% to +10% is excellent. Above +10% over 500+ bets puts you in the top 1% of bettors. Most recreational bettors run between -5% and -15%.
ROI vs. win rate: which matters more?
ROI, and it's not close. A bettor winning 40% of bets at +200 average odds has a strong positive ROI. A bettor winning 60% at -300 average odds is probably losing money. Win rate without odds context is misleading by design.
How many bets do you need before ROI is meaningful?
Fewer than 50 bets: statistically worthless. Around 200: starting to be meaningful. 500+: reliable trend. Below 200, you can look profitable from a good run or look bad from a rough stretch, and neither reflects your actual edge.